|

Case Icons
Icon Size
Case icons can be as small as 1 pixel and as large as 32 pixels across. There are three ways to change the size of case icons:
 . . . Using the Icon Size Slider . . . Using the Icon Size Slider
1.In the lower plot toolbar, drag the Icon Size slider to the right to make icons larger or toward the left to make them smaller.
 |
. . . Using the Icon/Tool Options Menu
1.In the lower plot toolbar, click the small double arrow to the right of the H button. This opens the Icon/Tool Options menu.
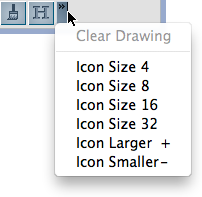 2.From the menu, choose one of four icon-size options or choose Icon Larger or Icon Smaller to adjust icon size in one-pixel steps. |
. . . Using Shift/+ and Shift/-
1.Press the Shift key along with the + or - key to change the case icon size one pixel at a time. |
Labels for Case Icons
You can add a label to each case icon. You can use this feature to show, for example, the name of each student in a collection or the gender of each case.
To label the icons in a plot with their attribute values,
2.
|
In the upper plot toolbar, click the Label button.
|
To change the attribute you use for labeling, turn off the Label button (by clicking it) and then repeat the steps above.
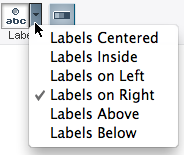
To change the position of the case icon label,
1.
|
In the upper plot toolbar, click the small triangle to the right of the Label button. This opens the Label Options menu.
|
2.
|
Choose the location you want.
|
Labels do not resize as you change the size of case icons. Because of this, labels usually are not very useful with large collections. However, you can make the case icons very small so that all you see is the labels. This is a way of making the labels themselves a type of case icon.
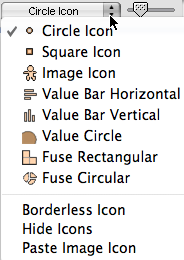
Case Icon Types
You can choose one of several icon types from the Icon Type menu on the lower plot toolbar. The name of the icon type currently being used in a plot is visible in the lower plot toolbar. The default setting is Circle Icon.
To change to one of the other icon types,
1.
|
Click the small black triangle to the right of the icon type in the lower plot toolbar.
|
2.
|
From the menu, choose the icon type you want.
|
Here's a brief description of the different icon types.
Circle Icon: By default, each case appears as a circle.
Square Icon: Each case appears as a square. You can stack squares to make graphs that look more like conventional bar graphs.
Image Icon: Each case appears as an image (for example, a cat or a person). You can change image icons or even make your own.
Value Bar Horizontal: Each case of a numeric attribute appears as a horizontal bar. The length of the bar shows the case's value.
Value Bar Vertical: Each case of a numeric attribute appears as a vertical bar. The height of the bar shows the case's value.
Value Circle: Each case of a numeric attribute appears as a circle whose size is proportional to its numerical value.
Fuse Rectangular: Case icons are joined together into rectangles (as in histograms). Individual cases are still potentially visible as individual squares or rectangles.
Fuse Circular: Case icons are joined together into circles (as in pie graphs). Individual cases are still potentially visible as individual pie wedges.
Borderless Case Icons
Case icons typically have a black border around them to make cases distinct from one another. Sometimes, especially with large collections, these black borders make a graph harder to read.
To remove the black borders from case icons,
1.
|
Choose Borderless Icons from the Icon Type menu on the lower plot toolbar.
|
That option will now appear in the Icon Type menu along with a check mark. To put borders back on icons,
1.
|
Choose Borderless Icons again to uncheck it.
|
Invisible Case Icons
By resizing case icons you can make them as small as one pixel in diameter. But sometimes you'll want them to disappear completely, such as when you make a box plot or frequency table. To make the case icons invisible,
1.
|
Choose Hide Icons from the Icon Type menu on the lower plot toolbar.
|
That option will now appear in the Icon Type menu along with a check mark. To make the case icons visible again,
1.
|
Choose Hide Icons again to uncheck it.
|
Reposition Case Icons
You can manually reposition icons in a plot. You might want to do this to spread out icons that are too close to, or overlapping, one another. You also might want to put case icons into groupings yourself, rather than have TinkerPlots do it for you.
You can freely reposition icons in a mixed-up plot. But you can also reposition icons in a plot that has bins (a plot where there is an attribute on at least one of the axes). You can also choose to have dragging always reposition cases, rather than separate them.
. . . in a Mixed-up Plot
To move case icons freely within a plot,
1.In the data cards, click the light blue bar to the left of the Attribute column heading. This deselects all attributes and makes the case icons the same blue color. 2.Click on a case icon and drag it to where you want it. Or select several cases at once and drag them together to a new location. You can also apply an attribute's color scheme to the mixed-up case icons and still reposition them. To do this, hold down the Alt (Win) Option (Mac) key before you drag. By holding down this key, you prevent the icons from separating into bins when you drag them. (Note that with this key down, the cursor looks like a hand when it's over a case.)
1. Click on the reposition tool in the lower plot tool bar.
2. Use the cursor, which appears as a hand with pointing finger, to move cases.
3. To move multiple cases at once, highlight them, then move with the cursor.

|
. . . in a Binned Plot
To reposition case icons within a bin,
1.Click on the reposition tool in the lower plot tool bar. 2.Use the cursor, which appears as a hand with pointing finger, to move a case within a bin. (If you move a case outside the bin, it will come back into the bin when you release.) If the cases are stacked within the bin, you will not be able to move a case icon anywhere you want and have it stay there. The icons will stay stacked as long as Stack remains on.
If the cases in a bin are not stacked, you can remix all of them within the bin. To do this,
1.Choose Remix from the plot's Options menu. |
Change Image Icons
Each collection that comes with TinkerPlots has an image icon available. The collection Cats.tp has images of cats; the collection Backpacks.tp has images of people. The document Case Icon Library.tp contains a collection of image icons you can use. The default image icon is the ball from the TinkerPlots logo.
To change the image icon of a collection,
1.
|
Open the document Case Icon Library.tp. This file should be in the TinkerPlots | Data and Demos folder on your computer.
|
2.
|
Click the icon you want to use to select it.
|
3.
|
Choose Copy as Picture from the Edit menu.
|
4.
|
Return to your TinkerPlots document and select the plot you want to paste this icon into.
|
5.
|
In the lower plot toolbar, open the Icon Type menu and choose Paste Image Icon. The new image icon will appear in the plot.
|
6.
|
Save. The image icon is saved with the collection. All plots using that data can use this image icon.
|
There are some disadvantages of using image icons in graphs rather than, say, circles. Image icons can make a graph look busy and make it harder to see general trends in the data. They also often make it harder to see the colors of the icons. And they take more computer memory and can slow down TinkerPlots animations. If TinkerPlots seems slow with image icons on, use circle icons to speed things up.
Also, if data are created with a Sampler, each time you run the sampler any image icon you may have pasted will be lost.
Make Your Own Image Icons
You can draw or modify an image to use as an image icon, using any painting or image editing program such as Microsoft Paint or Adobe Photoshop.
No matter what size you make an image icon, it will be resized to 32 by 32 pixels when pasted into a TinkerPlots document. So, to avoid distorted case icons it is best to use or make images that are 32 pixels square.
There are three parts to an image icon: the "visible parts" that make up the image, the "fill parts" that get colored with the attribute's color scheme, and the "transparent parts" such as the area around the image that will not be visible in TinkerPlots.
Here are some specifications to help you make each of these parts of an image icon.
Visible parts: Black is best, because colors may compete with the attribute's colors.
Transparent parts: Use pure white (100% value plus 0% saturation, or RGB "255," or Web color "FFFFFF," depending on the color picker you use).
Fill parts: Use 80% gray (80% value plus 0% saturation, or RGB "204," or Web color "CCCCC," depending on the color picker you use).
|
Copy Image Icons
You can copy pictures to use as image icons from any program that supports display and copying of images. This includes Internet Explorer, Microsoft Paint, Word, QuickTime, and Adobe Photoshop.
To copy an image from another application and paste it directly into TinkerPlots,
1.Select the image in the application, then choose Copy from the Edit menu. 2.Switch to TinkerPlots and choose Paste Image Icon from the Icon Type menu in the lower plot toolbar. To also paste the image into the Case Icon Library where it will be available for other collections,
1.Open the document Case Icon Library.tp and click in the document background (white area). No frames around images icons should be visible. 2.Choose Paste Picture from the Edit menu. |
TinkerPlots Help
© 2012 Clifford Konold and Craig D. Miller
|
|


