|

Working with Cases
Add Cases
To quickly add any number of new cases to a collection,
2.
|
Choose New Cases from the Data menu.
|
3.
|
In the dialog box, enter the number of new cases to add and click OK.
|
4.
|
Go to the newly created cases in the data cards or case table and enter data for the cases.
|
You can also add cases one at a time in data cards, case tables, or plots.
 . . . in the Data Cards . . . in the Data Cards
1.Go to the last data card either by using the arrows at the top of the cards or by pressing End on your keyboard. The last card in the stack is labeled "new case" in the upper-right corner.
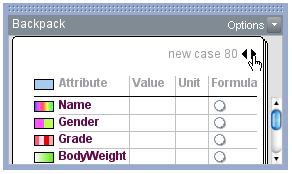 2.Click in one of the cells in the Value column and begin entering the data for the new case. 3.Press Enter. The new case will be added to the collection. Continue entering additional values for that case. |
. . . in a Case Table
1.Scroll to the last row of the case table (or press End). 2.Click in one of the cells and enter the value for one of the attributes. 3.Press Enter. The new case will be added to the collection. Continue entering additional values for that case. |
. . . in a Plot
1.Choose the Add Case tool from the lower plot toolbar.
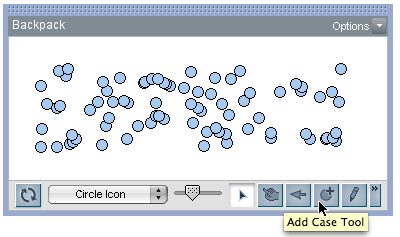 2.Click in the plot to add a new case. Click repeatedly to add multiple cases. If you have plotted attributes, the new case will be assigned values depending on where you click. 3.Add additional values for the new cases in the data cards or case table. |
Delete Cases
1.
|
Select the case(s) you'd like to delete in the data cards or case table.
|
2.
|
Choose Delete Cases from the Edit menu.
|
Note: Deleting cases permanently removes them from the collection. If instead you want to temporarily remove one or more cases from a plot, use the Hide Cases command, use a filter, or restrict the range of a plot axis. You could also temporarily delete the case from the collection and then later choose Undo from the Edit menu to restore it.
Sort Cases
To change the order in which cases appear in the case table or data cards,
1.
|
Click on the name of the attribute you want to sort by.
|
2.
|
From the Options menu of the data cards or case table, choose Sort Ascending or Sort Descending.
|
How do I sort by more than one attribute? Suppose you want to sort by both grade level and by name so that all the 11th graders (sorted by name) come before all the 12th graders (sorted by name). First sort by name, then by grade. The sort by grade won't disturb the sort by name.
Get Case Information
Looking at a plot, you'll sometimes want to see all the information about a particular case. To do this,
1.
|
In the plot, click the case that you want information about. The data card for that case will come to the top of the data cards stack. In the case table, that case's row will be highlighted.
|
Select/Highlight a Case
When you click a case, it is highlighted in all other objects in the document. If you have multiple plots of the same data, this allows you to easily see where a particular case is in each plot. Also, to delete a case, you must first highlight it. In data cards, you can only select one case at time. To select multiple cases, use the case table.
To select a case,
. . . in the Data Cards
1.Bring the case to the top of the stack by using the arrow keys toward the upper-right of the data cards. 2.Click the case circle at the top of the card. A thick border will appear around this circle to indicate that the case is now selected. To deselect the case, click beside the case circle. |
. . . in a Case Table
•Select a single case by clicking its row number. The row will now appear highlighted. •Select more than one case by dragging along the cases' row numbers. •Select contiguous cases by clicking the row number at one end of the desired location. Then hold down the Shift key and click the row number of the case at the other end of the series. •To select cases that are not contiguous, hold down Ctrl (Win) Command (Mac). •To deselect cases, click somewhere else in the case table. |
. . . in a Plot
•To select a case in a plot, click the case icon. A thick border will appear around the icon. •Select more than one case by dragging a selection rectangle around the case icons. •Select non-contiguous cases in the plot by holding down the Shift key while using the selection rectangle. •To deselect, click somewhere else in the plot. |
TinkerPlots Help
© 2012 Clifford Konold and Craig D. Miller
|
|


