|

Bins and Axes
Change Number of Numeric Bins
There are three ways to change the number of bins in graphs that have numeric axes:
 . . . by Dragging a Case Icon in the Plot . . . by Dragging a Case Icon in the Plot
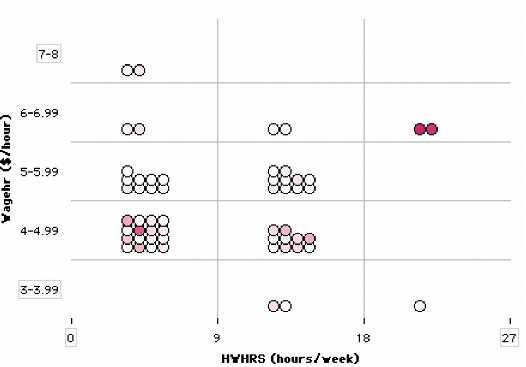
1.In the plot, drag a case icon to the right (or up) to make more bins; drag left (or down) to make fewer bins. By dragging icons, you can make from two to eight numeric bins. If you keep pulling after you have eight bins, the case icons will fully separate.
|
. . . by Dragging a Bin Line
1.In the plot, place the cursor over one of the bin lines. The cursor will change into a double arrow. 2.To make more bins, drag the bin line left (or down); to make fewer bins, drag the bin line right (or up). By dragging bin lines, you'll be able to make as many bins as you want before the attribute fully separates. As you drag the bin line, the axis labels change dynamically.
|
. . . by Changing the Axis Interval
1.Double-click one of the axis endpoints. (The endpoints are outlined in gray.) 2.In the dialog box, enter a new bin width and click OK. (Entering a smaller value will increase the number of bins. Entering "0" will fully separate the numeric axis.) |
Change Number of Category Bins
You can separate all values of a category attribute either in one step or one category value at a time.
Separate One Bin at a Time
To increase the number of category bins one bin at a time,
1.In the plot, go to the bin labeled "other" and drag any case icon out of the bin. That case, and all the cases with the same value, will move into a new bin. 2.Repeat step 1 until you have made as many bins (groups) as you want, or until the attribute is fully separated.
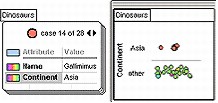 To decrease the number of category bins one bin at a time,
1.In the plot, go to a bin with only one type of value. For example, if the attribute is Eye_Color, you might go to a bin labeled "blue." 2.Drag a case from that bin toward the bin labeled "other." All the cases in the "blue" bin will move into the "other" bin. (If the attribute is already fully separated, dragging toward any bin will combine two bins and make a new "other" bin.) |
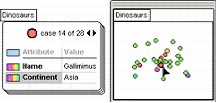
Separate Fully into Bins in One Step
To fully separate a category attribute into as many bins as possible in one step,
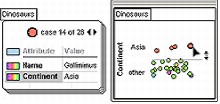
1.From the data cards, drag the name of the category attribute onto one of the plot axes (located on the left side and bottom of the plot). All of the different values of the attribute will be visible on the axis.
You might now want to create a bin that combines two or more particular categories. First move the two bins that you want to combine next to each other (see Reorder Category Bins). Then drag a case icon from one of the bins into the other bin. These two groups will mix in a new bin whose name combines the names of the individual bins. You can check on this combined name and edit the name.
|
Edit Bin Names
To edit the label of a bin of a category attribute,
1. Double-click the bin label on the axis of a plot.
2. In the dialog box, enter a new name and click OK.
The new label name does not change the value in the collection. If you redragged the attribute name to the axis, it would go away. But you can create a new attribute that will use this new value (see Create New Attribute from Plot Separation).
Adjust Axes
Change Axis Endpoints and Bin Widths
TinkerPlots automatically sets numeric axis endpoints and bin (or interval) widths. But sometimes you'll want to set these yourself. For example, you might want to make the axes for two plots identical. Or you might want to zoom in on part of the graph where cases are bunched together to see what's going on there. Or you might be dragging an extreme value to watch what happens to the mean and want to prevent the axis from automatically changing, which it would ordinarily do.
To adjust bin widths or axis endpoints of a numeric axis,
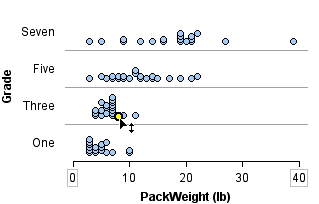
1.Double-click the axis endpoint you want to change or the width of the first or last bin. These endpoints and widths are lightly outlined in gray. 2.In the dialog box, enter the value you want for the endpoint or bin width. 3.Click OK.
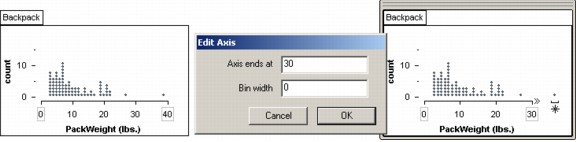 In the example above, the endpoint was changed from 40 to 30. The case near 40 has moved off the axis and into the "excluded cases" stack, marked with an asterisk (*). Also, the upper end of the axis now has a >> symbol added. This tells you that there is at least one value beyond the current axis maximum of 30 that is not plotted over the axis.
At the same time you set a maximum or minimum for your axis, you can also set a bin width. Note that if you set both a new bin width and a new maximum, TinkerPlots might have to change the minimum value on the axis to give you what you want.
|
Return to Default Axes
If you have edited your axes but now want to return to the default settings,
1.Drag the attribute name from the data cards back onto the axis. |
Reverse Axis Endpoints
By default, a numeric axis increases in value from left to right or from bottom to top. To reverse an axis so that the values decrease from left to right or from bottom to top,
1.Drag one of the axis endpoints (outlined in gray) toward the other end of the axis. |
Reorder Category Bins
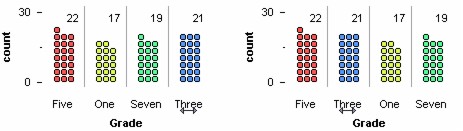
You can freely reorder the bins of a category attribute. For example, you might want to arrange them according to how many cases are in each bin.
To move a category bin to a different place on the axis,
1.
|
Drag a bin label to a new location along the axis.
|
Use Continuous-style Bins
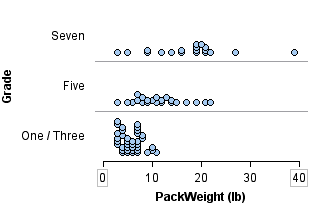
By default, bins of numeric attributes are labeled with their individual ranges, as shown on the vertical axis of the plot below. As an option, you can use a continuous style of labeling bins, as shown on the horizontal axis.
To use continuous-style bins,
1.
|
Select the plot, and choose Continuous-style Horizontal Bins or Continuous-style Vertical Bins from the plot's Options menu.
|
2.
|
Choose the option again to revert to standard bins.
|
TinkerPlots Help
© 2012 Clifford Konold and Craig D. Miller
|
|


