Change Data Values


Change Data Values |
|
|
Change Data Values You can change the values of cases directly in a plot by dragging a case icon along an axis. As you drag, the case changes its value to the position you've dragged it to. This works for both numeric and category attributes. To change the value of a case in a plot, you need at least one attribute on an axis.
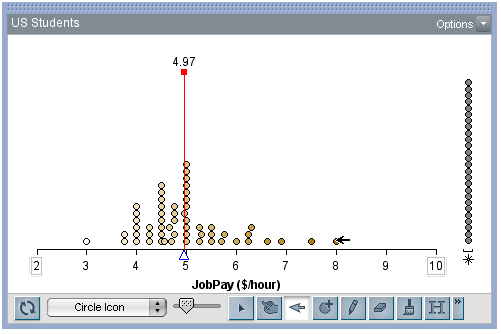
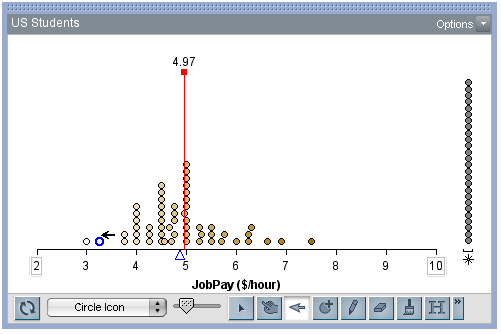
If you drag a case along a binned, numeric axis, the case is given the value of the lowest value of the bin. So a case dragged into a bin of heights that ranged from 60 to 63 would be given the value 60. If the plot has attributes on both axes, you can drag a case both horizontally and vertically, changing its values for both attributes at the same time. If you want the case to change its value for only one of the graphed attributes, be careful to move it in only one dimension. Tip: You can use the Drag Value tool to demonstrate the influence of an extremely high or low value on the mean. The graph shows how many dollars per hour high school students earned in their part-time jobs. The location of the mean (about $8/hour) is shown as a blue triangle under the axis. Using the Drag Value tool, move the case at $10/hour toward the center of the graph. As the case moves to the left, the mean triangle will also move to the left, but more slowly, of course. The reference line placed over the current mean helps show how much the mean changes. Also, the demonstration works better if you fix the maximum value of the axis at 10, to prevent the axis from automatically changing as the maximum value changes.
|