TinkerPlots Terms


|
TinkerPlots Terms |
|
|
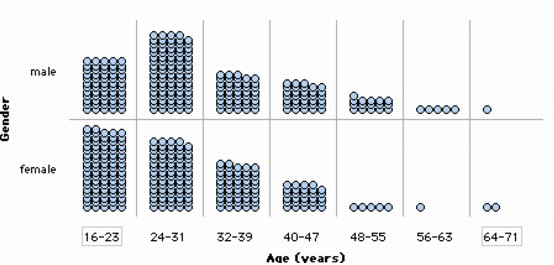
TinkerPlots Terms A collection is a set of data about several cases. For example, the collection Cats.tp, which comes with TinkerPlots, contains information on 24 cats. A case is the basic unit of a data set or collection. For example, in a collection of cats, each cat is a case. In a collection about different countries of the world, each country is a case. Information about each case is recorded on one card in the data cards. Each case also has a case icon in a TinkerPlots plot. Cases have attributes (also known as variables). For example, a collection about cats might include, for each cat, the attributes Gender, Length, and Fur_Color. Attribute names for a collection are listed on the left side of each data card. Each case has a value for each attribute. A particular cat might have the values "Male" for Gender, "21" for Length, and "Black" for Fur_Color. The value appears directly to the right of the attribute name in the data cards. A numeric attribute, such as Length or Age, has numbers for values. You can plot numeric attributes on a number line and find their mean. A category attribute has values that are letters or words. Gender is a category attribute with the possible values "Male" and "Female." Fur_Color is also a category attribute with values "Black," "White," "Black_and_White," and so forth. You can graph category attributes by separating cases into their different categories. Unlike numeric attributes, you can't plot category attributes on a number line or find their mean. To the left of each attribute name in the data cards is an attribute color bar that shows that attribute's color scheme. In a case table, the color bar is beneath an attribute name. You can modify an attribute's color scheme by double-clicking on its color bar. This is the attribute currently selected in the data cards or case table. When an attribute is selected, a gray rectangle appears around its name in the data cards, and the case icons in the plot are colored with that attribute's color scheme. When you select an attribute in the data cards, the case icons in the plot take on that attribute's color scheme. For numeric attributes such as Age, the case icons are colored with a gradient-different shades of red, for example. The cases with the largest values have the darkest hue (dark red, for example), while cases with the smallest values are near white. For category attributes, case icons with different values are colored with distinct hues, such as red, green, and purple. Bins are divisions in plots that contain all cases of a certain type. Bins are separated by light-gray bin lines. You might want to have "males" and "females" in separate bins, for example. For a numeric attribute such as Age, you might place people 16-23 years old in one bin, 24-31 in the next, 32-39 in the next, and so on.
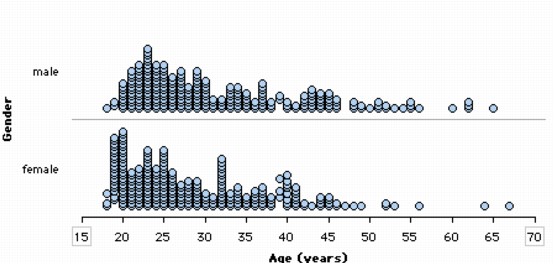
When you separate an attribute into as many bins as possible within a plot, the attribute is fully separated. When a numeric attribute such as Age is fully separated, the axis appears as a continuous number line and there are no visible bin lines.
Often a case will be missing a value for one attribute. A cat's age, for example, might have been left blank because it was a stray and no one knew its age. In this instance, when the attribute Age is selected, the case icon for that cat will be colored gray. If you put Age on a plot axis, the case's icon will move to the right side of the plot window into the excluded cases stack. Also, suppose you wanted your graph to show only those cats that were 2 years and older. You could set the minimum value of the Age axis at 2, which would cause all cats younger than 2 to move into the excluded cases stack. There are several case icon types you can choose for a TinkerPlots graph, including circle (the default), square, value bar, and fuse rectangular. The image icon type allows you to make a graph with icons resembling cats, for example. You can use an attribute formula to compute the values of an attribute. For example, you could use a formula to convert heights measured in inches to heights measured in centimeters, or to divide the attribute Income of various countries by the attribute Population to make a new attribute, Income_per_Person.
|