Plots


Plots |
|
|
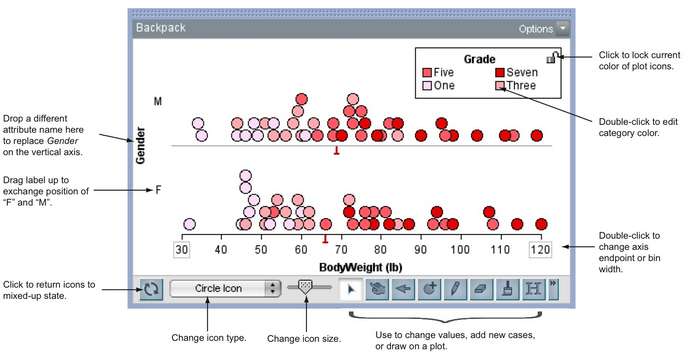
Plots Use plots to organize your data graphically to search for interesting patterns or group differences. Here we mention some of the more general things you can do in plots. See Working with Plots for more detailed information.
•Click an icon to select it. This will also bring that case's data card to the top of the stack and will highlight that case in a case table or in another plot. •To remove everything from a plot and start over, click the Mix-up button on the toolbar on the bottom of the plot. •Improve the appearance of a plot by resizing it (drag a corner) or by resizing the plot icons (adjust slider on lower controls). •To add an attribute to one of the plots' axes, drag the attribute name from a data card, a case table, or another plot and drop it on either of the axes. •For numeric attributes, drag any icon to the right (or up) to make up to eight bins. To make fewer bins, drag an icon to the left (or down). •Drag a bin line of a numeric attribute to the left (or down) to make more, narrower bins. Drag to the right (or up) to make fewer, wider bins. •For category attributes, drag a case in any direction to separate out all cases with that value from the rest of the cases. •Choose one of several icon types from the Icon Type menu on the lower plot toolbar. •Double-click on either endpoint of an axis to change that endpoint and/or the bin width. To restore the default axis values, redrag the attribute from the data cards onto the axis. •Some plot features, such as dividers and hat plots, only appear on fully separated plots-plots that have no bin divisions and a continuous, numberline axis. •Choose Swap Axes from the plot's Options menu to switch the attribute on the vertical axis with the attribute on the horizontal axis. •To remove attribute colors from the plot icons, click the light blue bar in the upper left of the data cards. •To prevent a plot's color from changing, select the plot and click the Key button on the upper plot toolbar. Close its lock by clicking it. •Choose Hide Selected Cases from the plot's Options menu to remove highlighted cases from the plot. You can use this multiple times to exclude more and more cases.
|