Case Tables


Case Tables |
|
|
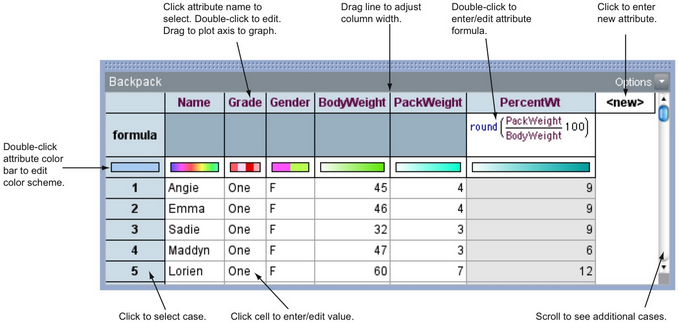
Case Tables Case tables display data in a table format, with attribute names along the top of the table and each case in a separate, numbered row. With a case table you can see multiple cases at once, add or change data, drag attributes names into plots, and sort your data.
•Press Tab to move to the next cell; press Enter to move down one row. •To see the formula row (as above), choose Show Formulas from the table's Options menu. •Resize the formula row by dragging the bottom of its row. •To make a plot using an attribute, drag that attribute's name to a plot axis. •To select an attribute, click that attribute's name. When an attribute is selected, the icons in a plot are colored with that attribute's color scheme. •To add a new attribute, click the cell labeled <new>. •To change where an attribute appears, drag the attribute name to new location. •To rename an attribute, double-click its attribute name. •To hide an attribute in a case table, select the attribute by clicking it, then choose Hide Attribute from the table's Options menu; to display hidden attributes, choose Show Hidden Attributes. •To delete an attribute, click it once to select it, then choose Delete Attribute from the Edit menu. •To insert an attribute in a particular place, select the attribute to the right of that place, then choose New Attribute from the Data menu. •Edit the formula of an attribute by double-clicking the current formula in the Formula row. •To select and highlight a case, click its row number. •To enter data for a new case, go to the last row in the table and enter values for the case. •To edit data for a case, click the appropriate cell and enter the new value. •To delete a case, select it by clicking its row, then choose Delete Case from the Edit menu.
|