Data Cards


Data Cards |
|
|
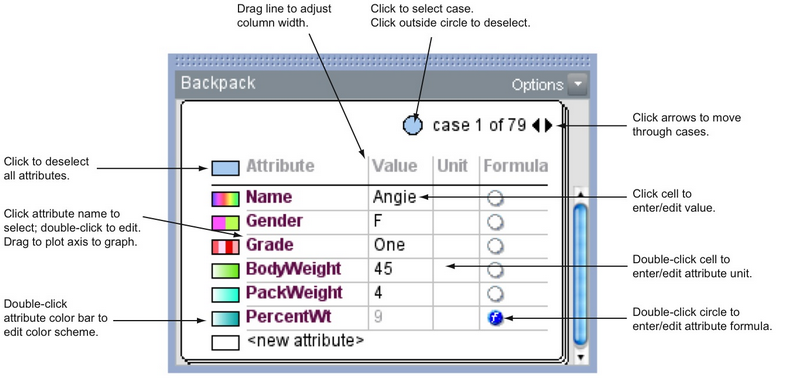
Data Cards Data cards give you a case by case view of a data set. Using data cards you can add or change data, drag attributes into plots, and change the color scheme of attributes. You can use other objects, namely case tables and plots, to see your data displayed in other ways.
•Press Tab to move down a column of values or units. When you're at the bottom row, Tab moves you to the next data card. •Press the Home key to go to case 1; press the End key to go to the last case. •Drag the lower-right corner to resize the stack. •Select Options to see additional capabilities. •To make a plot using an attribute, drag that attribute's name to a plot axis. •To select an attribute, click that attribute's name. When an attribute is selected, the icons in a plot are colored with that attribute's color scheme. •To change an attribute's color scheme, double-click the color bar next to that attribute's name. •To deselect all attributes, click the light blue color bar at the upper left of the data cards. Clicking here also colors all case icons the same, light blue color. This is especially useful for seeing highlighted icons in the plot, as highlighted cases will be colored red. •To add a new attribute, double-click in the bottom row labeled <new attribute>. •To rename an attribute, double-click its attribute name. •To delete an attribute, click it once to select it. Then choose Delete Attribute from the Edit menu. •To insert an attribute in a particular position, select the attribute in the row below where you want the new one to appear, then choose New Attribute from the Data menu. •To enter or edit the unit name of an attribute, click in a cell in the Unit column. •A blue circle in the Formula column indicates an attribute that is computed by formula. Double-click the blue circle to see or edit the formula. Double-click a white circle to create a formula for an attribute. •To change the position of an attribute, click on the name and drag it to the desired location. •To bring a particular case to the top of the stack, click the arrows in the upper-right corner; or click the case's icon in a plot. •To select a case, click the colored circle at the upper right of a card; click next to the circle to deselect the case. •To enter data for a new case, go to the last card in the stack. (Press the End key to go directly to the last card.) •To edit data for a case, click a cell in the Value column and enter the new value. •To delete a case, click the colored circle at the top of the card to select the case. Then choose Delete Case from the Edit menu. •To enter or edit the attribute value of a case, click a cell in the Value column.
|