|

Histogram
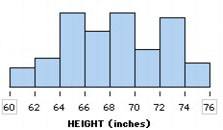
Histograms cluster cases of numeric attributes within intervals. They are especially useful when you have a large number of cases.
To make a histogram,
1.
|
Put a numeric attribute on the horizontal axis. From the data cards, drag the name of a numeric attribute onto the horizontal axis of the plot (the lower part of the plot will highlight to indicate when you can drop).
|
2.
|
Separate the attribute into bins. In the plot, drag any case icon to the right to create more bins (up to eight); drag left to reduce the number of bins.
|
3.
|
Stack vertically. In the upper plot toolbar, click the Stack Vertical button.
|
4.
|
Fuse the icons. In the lower plot toolbar, choose Fuse Rectangular from the Icon Type menu.
|
You can fine-tune the interval width either by dragging the bin lines or by setting the interval width.
TinkerPlots Help
© 2012 Clifford Konold and Craig D. Miller
|
|


