Value Circle Graph


Value Circle Graph |
|
|
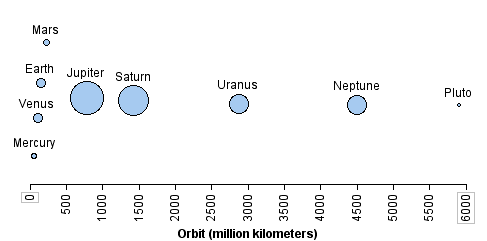
Value Circle Graph In this graph, planets are displayed as circles whose size is proportional to the radius of each planet.
To make a value circle graph,
Note: In this example, we've also put the attribute Orbit on the horizontal axis and fully separated it so that the planets are arranged according to their average distances from the sun. We added the planet names as labels by selecting Name in the data cards and then clicking the Label button in the upper plot toolbar. Finally, we used the Reposition tool on the lower plot toolbar to adjust the vertical positions of the circles so that labels or circles were not overlapping.
|