Dot Plot

Previous  Terms  Next

TinkerPlots_logoV2-rgb


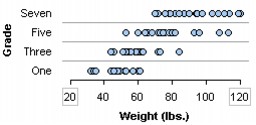
Dot Plot

This graph displays all the cases of a numeric attribute in a single line that runs parallel to the axis. It is especially useful for comparing the distributions of several groups.

TinkerPlotsHelp-1-061-075

To make a dot plot,

1.

Put a numeric attribute on the horizontal axis. From the data cards, drag the name of a numeric attribute onto the horizontal axis of the plot (the lower part of the plot will highlight to indicate when you can drop).

2.

Fully separate the attribute. In the plot, drag any case icon all the way to the right (until there are no bin lines). This will fully separate that attribute horizontally.

3.

Stack horizontally. In the upper plot toolbar, click the Stack Horizontal button.

In this example, the category attribute Grade was added to the vertical axis (drag the attribute name into the left side of the plot) and the values of Grade were reordered (drag the value name to the desired location).


TinkerPlots Help

© 2012 Clifford Konold and Craig D. Miller