|

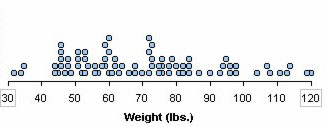
Stacked Dot Plot
This graph shows how a numeric attribute is distributed while keeping each case clearly visible.
To make a stacked dot plot,
1.
|
Put a numeric attribute on the horizontal axis. From the data cards, drag the name of a numeric attribute onto the horizontal axis of the plot (the lower part of the plot will highlight to indicate when you can drop).
|
2.
|
Fully separate the attribute. In the plot, drag any case icon all the way to the right (until there are no bin lines). This will fully separate that attribute horizontally.
|
3.
|
Stack vertically. In the upper plot toolbar, click the Stack Vertical button.
|
TinkerPlots Help
© 2012 Clifford Konold and Craig D. Miller
|
|


