|

Import Data
You can quickly import data into TinkerPlots from the Internet or from some other application, such as spreadsheet software or a word processor. There are three ways to do this: copy and paste data, import data from a text file, and import data from the Internet.
Copy and Paste Data
1.
|
From within the application that contains the data (a word processor, spreadsheet, Web page, or whatever), highlight the entire collection and then copy it. Make sure the attribute names are in the first line you copy and that you copy nothing but the data.
|
2.
|
Click in a TinkerPlots document.
|
3.
|
Create a new stack of data cards or case table and make sure it is selected. (An object is selected when you can see its frame. Clicking an object will select it.)
|
4.
|
Choose Paste Cases from the Edit menu.
|
Import Data from a Text File
1.
|
Create a new TinkerPlots document by choosing New from the File menu.
|
2.
|
Choose Import From File from the File menu.
|
3.
|
In the dialog box, select the file you want to import, then click Open.
|
Or,
1.
|
Drag the text file into a TinkerPlots document. The data will appear in a stack of data cards.
|
Note: This method of importing data works only if the file is in text format. If it isn't in text format, you'll first need to open the file from within the program that made it (Microsoft Word or Excel, for example), and then use the Save As command to save the file as a text file. TinkerPlots is fairly good at recognizing different text file layouts. But the easiest layout for TinkerPlots to deal with has the names of the attributes in the first line and the values below them, one line (paragraph) per case, as shown here. The values can be separated by tabs or by spaces.

If your data imports, but uses the first case as the attribute names, open the text file in a word-processing program and add a line at the top with the attribute names. Then import this edited file.
Import Data from the Internet
1.
|
Find the data you want on the Internet. Be sure you're looking at the page with the data (not a link to that page).
|
2.
|
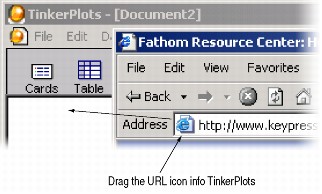
Drag the URL icon from your browser into an open TinkerPlots document. TinkerPlots will import the data into a new stack of data cards.

|
Or,
1.
|
Choose Import From Url from the TinkerPlots File menu.
|
2.
|
Type or paste the URL of the data you want into the dialog box and click OK. The data will appear in a new stack of data cards.
|
Once the data are in TinkerPlots, check to make sure they imported correctly. The easiest way to do this is to look at them in a case table. You may need to do a little repair work by editing some of the data. If there are a lot of problems, it may be easier to export the data into a word processor or spreadsheet, fix the problems there, then import the data back into TinkerPlots.
•Didn't get a color gradient for numerical data? Sometimes when you import a collection, a numeric attribute will appear and behave like a category attribute. That is, its color bar will show distinct colors rather than a gradient, and when you graph the attribute, it won't make a number axis. What is probably going on is that one or more values of the attribute are characters rather than numbers. Even one case with some text in it will cause the entire attribute to be treated as a category attribute. To fix this, find and remove the text.
Other information that was on the Web page ("meta data") are also saved when you import from the internet. To see this information,
1.
|
Select the stack of data cards containing the data you just imported.
|
2.
|
Select Inspect Collection from the Object menu. This will open an Inspector window.
|
3.
|
Click on the Comments tab to see the meta data.
|
You might want to paste the information describing the attributes into a text object so that it is always visible in your document.
TinkerPlots Help
© 2012 Clifford Konold and Craig D. Miller
|
|


