Hat Plots


Hat Plots |
|
|
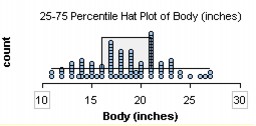
Hat Plots Hat plots divide a numeric attribute into three sections that look somewhat like a hat. There is a central "crown" and, on either side of the crown, two "brims." The brims extend out to the minimum and maximum values. The example shows a percentile hat plot for the body lengths (in inches) of 100 cats and includes a stacked dot plot distribution of the same data.
To make a hat plot,
In the Hats Options menu, you can select among four types of hat plots. Each type uses a different rule for constructing the central crown.
* The average deviation and standard deviation are measures that tell you how far, on average, each score is from the mean. You can find the formula for the standard deviation in most statistics books. You hear less often of the average deviation, but it is easier to understand. Suppose you had the heights of 20 males and that the mean of the 20 heights was 65 inches. To compute the average deviation, you'd start by subtracting the mean of 65 from each of the 20 scores. So if the first male in the collection was 63 inches tall, you'd get a difference of -2 after subtracting the mean. You'd ignore the sign and just call the difference 2. The next height might be 65.5 inches, and you'd get a value of 0.5 inch after subtracting the mean. After computing this difference for each score, you'd add all the differences. Finally, you'd divide this sum of differences (say it was 30) by the number of cases, 20. This would give you an average deviation (in this example) of 1.5 inches, which would tell you that on average each score is 1.5 inches from the mean. The default locations of the crown edges of each type of hat plot are somewhat arbitrary, but you can adjust them by dragging either crown edge once the plot appears. In this way, you could make percentile hat plots that included 90% of the cases in the center part, or standard deviation hat plots that included all the values between -2 and +2 standard deviations.
|