|

Counts and Percents
Counts show the number (or percent) of cases within each section of a graph. To see the number or percent of cases that are in various parts of a graph,
1.
|
In the upper plot toolbar, click the Counts (N) button or the Counts (%) button.

|
If there are no sections (bins or dividers), the Counts (N) button will show the total number of cases in the plot.
Percent Display Options
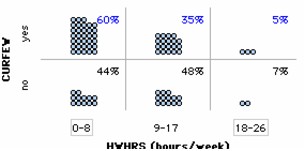
For binned graphs with attributes on both axes, there are three types of percents you can display in a cell (a cell is created by the intersection of two bin lines, as in the example).
 Row Percents Row Percents
By default, TinkerPlots displays row percents. Row percents are computed by dividing the number of cases in a cell by the total number of cases in that same row. In the example below, the 60% in the upper left cell is a row percent. It tells you that of the total 55 students with curfews, 60% (33 ÷ 55 x 100) report spending from 0 to 8 hours on homework per week. The percents along the top are all blue to remind you that these are row percents (note that the percents in each row sum to 100%, with possible rounding error).
|
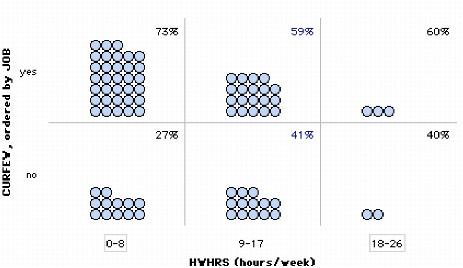
Column Percents
Column percents are computed by dividing the number of cases in a cell by the total number of cases in the same column.
To display column percents,
1.In the upper plot toolbar, click on the small triangular button to the right of the Counts (%) button. This opens the Percentage Options menu.
2.Choose Show Column Percents. If in the example you switch to column percents, the value in the upper-left cell changes from 60% to 73%. This column percent tells you that of the 45 students who reported spending from 0 to 8 hours per week on homework, 73% of them (33 ÷ 45 x 100) had a curfew. The percents in the same column are all the same color (blue or black) to remind you that these are column percents.
|
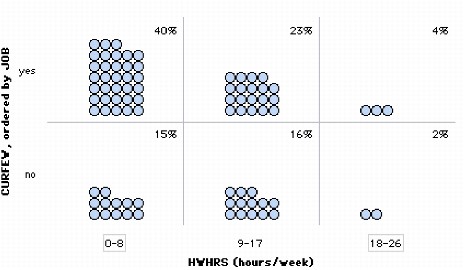
Cell Percents
Cell percents are computed by dividing the number of cases in a cell by the total number of cases displayed in the plot.
To display cell percents,
1.Click on the small triangular button to the right of the Counts (%) button in the upper plot toolbar. This opens the Percentage Options menu. 2.Choose Show Cell Percents. If you switch the example graph to cell percents, the value in the upper left cell would change from 60% to 40%. This cell percent would tell you that of the total 82 students, 40% (33 ÷ 8 x 100) both have a curfew and report spending from 0 to 8 hours per week on homework. The percents in all the cells would be black to remind you that these are cell percents.
|
TinkerPlots Help
© 2012 Clifford Konold and Craig D. Miller
|
|


