Types of Samplers


Types of Samplers |
|
|
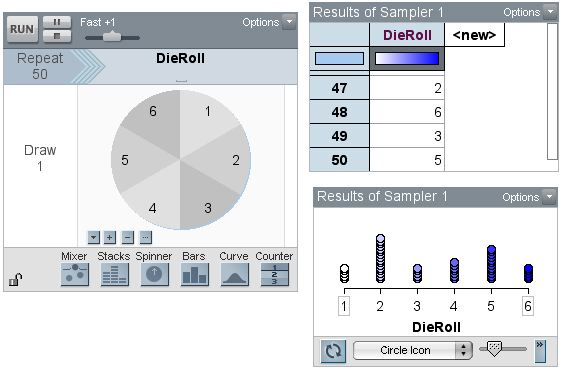
Types of Samplers You can add multiple devices to a single sampler and connect devices either in-line or by branching. Because of this, you can use the sampler to model a large variety of processes and situations. Here we give a brief overview of the general types of sampler designs and some of their uses. Watch the movie "Building a Data Factory" for a quick overview of the sampler's capabilities and uses. Single Device, Single Draw Below we model rolling a single die 50 times. Running this sampler produces a single attribute, here DieRoll, and 50 cases. In this example, you might be interested in what the distribution of the outcomes 1–6 might look like if you rolled a die 50 times. The distribution of the results from these 50 trials is shown in the plot below the results table. The shape of this distribution will change considerably each time you click RUN. You might explore how changing the Repeat number affects the appearance of this shape.
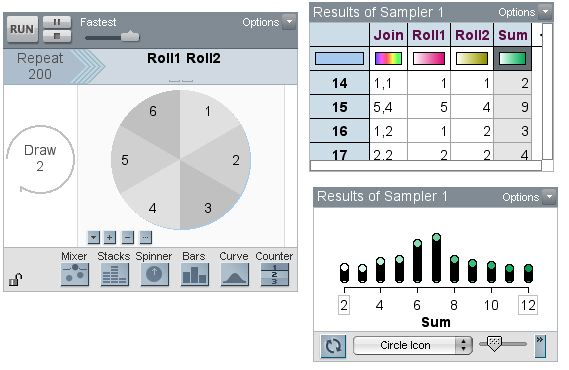
Single Device, Multiple Draw By changing the Draw number in the sampler above from 1 to 2, you can model the rolling of two dice. Now when you click RUN, you get the attributes Join (the results of both rolls together) as well as the results from the first roll (Roll1) and second roll (Roll 2). The attribute Sum has been added to the results table by choosing Result Options from the results table's Options menu, then checking "Sum of Joined Values" on the Results Attributes panel. Again, you might be interested in exploring the shape of the distribution of sums as you change the Repeat number (currently set at 200).
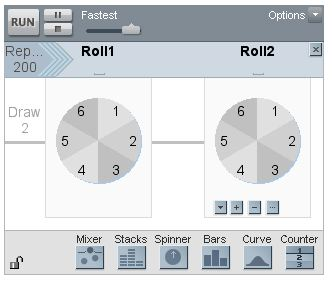
Multiple Inline Devices If you drag a mixer from the bottom of the sampler and drop it to the right of the existing die spinner, you will add a second spinner, as shown below. These two spinner will generate the same sort of data that the sampler above does. But rather than drawing twice from one spinner, it draws first from the left spinner and then from the right spinner. For many people, this feels more like the situation of rolling two dice, while the model above seems more like rolling the same die twice.
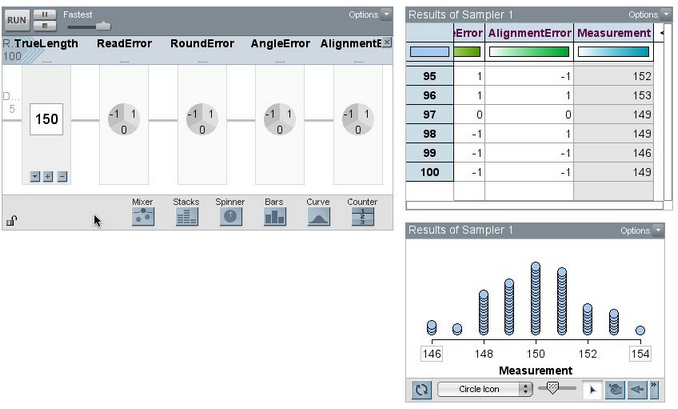
You can put as many devices in line as you want, and they can be different types of devices. Below is a sampler for modeling measurement errors associated with measuring a desk that is exactly 150 cm long. The true length is modeled at the left side of the sampler in a counter device. When a counter has only one element (is a constant), it appears as a simple box. To the right of this device are four spinners built to model various sources of errors associated with measuring with a ruler. For each source of error, you can either introduce an error of –1, +1, or 0 (no error), and these are set to occur with equal probability (because all the areas are equal).
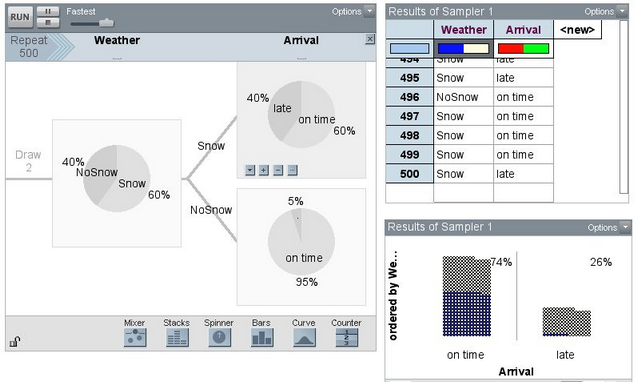
The attribute Measurement, visible in the rightmost column of the results table, is the sum of TrueLength and the four values randomly drawn from the error spinners. This attribute was created using "Sum of Joined Values," as described above. You can use this sort of sampler to explore error in repeated measurements, in particular to demonstrate why such measurements generally produce mound-shaped distributions. You could also explore what is meant by biased versus unbiased measurements. For example, you could change the AngleError spinner by removing –1 and making 1 more likely than 0, and then seeing how this changes the distribution of measurements. Multiple Branched Devices In many real-life situations, what happens next depends on what happened before. We often refer to these sorts of situations as involving conditional probability. To model situations like these, you can create branched devices. Suppose the probability that people are at least five minutes late to work at a particular company is 5% when the weather is good. But when it snows, this probability is 40%. Tomorrow there is a 60% chance of snow. What's the overall probability that people will be at least five minutes late to work tomorrow? This, of course, depends on whether it snows or not. The sampler below uses a spinner to model the probability of snow. The arrivals at work are modeled using two spinners. When these were created, the branches were automatically labeled "Snow" and "NoSnow" using the two elements in the Weather spinner. When you run this sampler on slow speed, you can see that when the spinner arrow lands in the "Snow" region, the simulation takes the upper "Snow" branch. Thus, this case gets its Arrival value from the upper spinner, in which the probability of being late is 40%. The results from 500 repeats are displayed in the plot, which shows that, at least in these 500 trials, 26% of the time people were late. (The blue cases are days when it did not snow, and the lighter cases are the snow days.) This 26% is an estimate of the probability of being late tomorrow given that there is a 60% probability of snow. Running this model several times and keeping track of what you get, or increasing the sample size, will give you more accurate estimates.
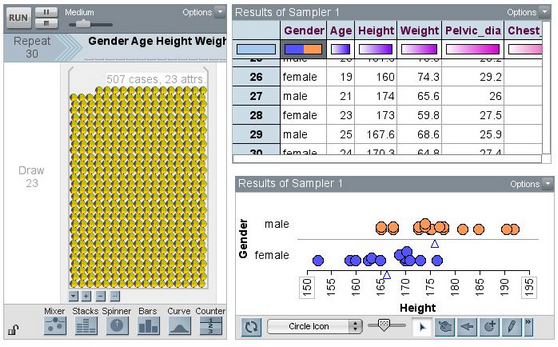
Single Device, Multiple Attributes You can also use the mixer to draw random samples from large, multi-variate collections. In the sampler are the cases from the collection Body Measurements.tp (found by choosing File | Open Sample Document). This collection has 507 cases and 23 attributes. To put them in the mixer, we opened the collection, selected the collection and chose Edit | Select All Cases, then Edit | Copy Cases. Then we opened a new document, dragged a new sampler from the shelf, and removed the existing elements so that the mixer was empty. Then we clicked the sampler to select it, and chose Edit | Paste Cases. All cases are now in the mixer. The elements in this mixer appear as multi-colored circles. This is to show that each element in fact has values for multiple attributes, including Gender, Age, Height, and so on. In the example, we have randomly sampled 30 cases, without replacement, and then graphed the results in a plot.
The values displayed in the mixer elements are the values of the first attribute in the collection. Therefore, if there are particular values you want displayed in the mixer, make sure that attribute is the first one.
|