|

Options Menus
Data cards, case tables, plots, and samplers have an Options menu located in the upper right corner. These menus are described below.
Data Cards Options
The data card's Options menu controls sorting the data in the data cards. This is how the data card's Options menu appears in Windows:
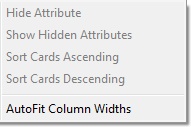
Hide Attribute
|
Hides (or shows) the selected columns (attributes).
|
Show Hidden Attributes
|
Unhides hidden attributes in a case table.
|
Sort Cards Ascending
|
Sorts cases in data cards in ascending order of selected attribute from smallest to largest.
|
Sort Cards Descending
|
Sorts cases in data cards in descending order of selected attribute from largest to smallest.
|
AutoFit Column Widths
|
Adjusts column widths to smallest size that doesn't truncate attribute names and values.
|
Case Table Options
The case table's Options menu controls attribute and formula display and sorts the data in the table. This is how the case table's Options menu appears in Windows:
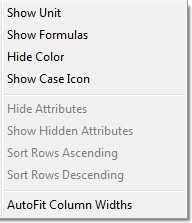
Show Unit
|
Displays (or hides) the units field in a row directly under the attribute names.
|
Show Formulas
|
Displays (or hides) attribute formula row for viewing and editing of attribute formulas.
|
Hide Color
|
Hides (or displays) the color bar for each attribute.
|
Show Case Icon
|
Shows (or hides) a column showing an icon for each case. The icon is colored according to the selected attribute.
|
Hide Attributes
|
Hides (or shows) the selected columns (attributes).
|
Show Hidden Attributes
|
Unhides hidden attributes in a case table.
|
Sort Ascending
|
Sorts cases in case table in ascending order of selected attribute from smallest to largest.
|
Sort Descending
|
Sorts cases in case table in descending order of selected attribute from largest to smallest.
|
AutoFit Column Widths
|
Adjusts column widths to smallest size that doesn't truncate attribute names and values.
|
Plot Options
The plot's Options menu controls axes, filters, hides cases, and lets you customize the plot toolbars. This menu is located in the upper right hand corner of the plot. This is how the plot's Options menu appears in Windows:
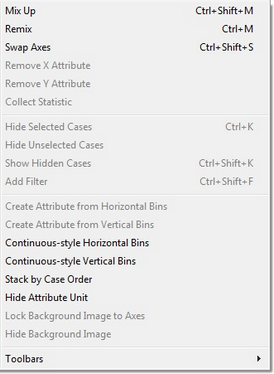
Mix Up
|
Returns a plot to its original, disorganized state. This is the same as pressing the Mix-up button in the lower plot toolbar.
|
Remix
|
Remixes unstacked cases within a bin.
|
Swap Axes
|
Swaps the attributes on the horizontal and vertical axes. If only one attribute is plotted, it will move to the other axis.
|
Remove X Attribute
|
Removes attribute from horizontal axis.
|
Remove Y Attribute
|
Removes attribute from vertical axis.
|
Collect Statistic
|
Sends highlighted statistic in the plot (e.g., mean, count, percentage), to a new "history" collection. This is especially useful when the value is changing, as it does when the data are being repeatedly randomly generated.
|
Hide Selected Cases
|
Hides cases that are selected in the plot.
|
Hide Unselected Cases
|
Hides cases that are not selected in the plot.
|
Show Hidden Cases
|
Unhides any cases that are hidden in the plot.
|
Add Filter
|
Adds a filter to the plot. If there is no current filter formula, the formula editor will appear. You enter a formula that specifies the cases to keep in the plot.
|
Create Attribute from Horizontal Bins
|
Creates a new attribute that uses the existing bins along the horizontal plot axis as values. This is useful in recoding data.
|
Create Attribute from Vertical Bins
|
Creates a new attribute that uses the existing bins along the vertical plot axis as values. This is useful in recoding data.
|
Continuous-style Horizontal Bins
|
Changes the way horizontal numeric bins are labeled, placing one value directly under each bin line.
|
Continuous-style Vertical Bins
|
Changes the way vertical numeric bins are labeled, placing one value directly under each bin line.
|
Stack by Case Order
|
Stacks cases by case order. Otherwise, they are stacked in random order.
|
Show/Hide Attribute Unit
|
Shows (hides) the attribute unit (if there is one) on the axis.
|
Lock Background Image to Axes
|
Locks the background image in the plot to the axes so that the image scales with the axes.
|
Hide Background Image
|
Hides (or shows) the plot's background image.
|
Toolbars
|
Allows you to remove the upper or lower plot toolbars entirely or to remove particular buttons from the toolbars.
|
Sampler
From the sampler's Options menu, you can view panels that will allow you to modify Sampler Options, Result Attributes, and History Options.
Sampler Options
The Sampler Options panel (inspector) includes controls that let you run until a particular condition, add to (or replace) data from previous runs, and change the delimiter used in the Join outcome. This is how the Sampler Options panel appears in Windows:
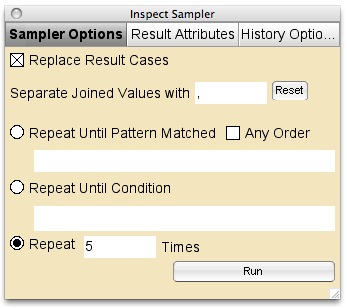
Replace Results Cases
|
Check to replace old results with new results from the sampler; uncheck to add new results to existing results.
|
Separate Joined Values with
|
Changes the delimiter that separates individual elements in the Join outcome. The default is a comma.
|
Repeat Until Pattern Matched
|
Instructs the sampler to run until the outcome you specify is matched.
|
Repeat Until Condition
|
Instructs the sampler to run until the condition you specify is satisfied.
|
Repeat
|
Instructs the sampler to repeat the number of times you specify.
|
Result Attributes
The Results Attributes panel includes controls for the results table and also pre-built formula attributes that you can click to add to the results table. (For more information, see Results Options). This is how the Results Attributes panel appears in Windows:
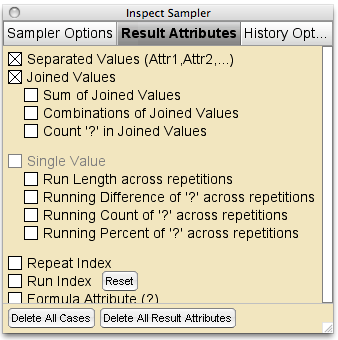
Separated Values
|
Uncheck to remove from results table the individual attributes created when draw number is 2 or more
|
Joined Values
|
Uncheck to remove attribute Join when draw number is 2 or more
|
Sum of Joined Values
|
Computes the sum of the numeric values of Join . Example: If Join is the results of rolling a die twice, this will compute the sum of the two rolls.
|
Combinations of Joined Values
|
Computes the combinations of Join. Combinations disregard order and thus consider the outcome "h, t" and "t, h" to be the same
|
Count '?' in Joined Values
|
Computes the number of times a specified element appears in each value of Join.
|
Single Value
|
When draw number is 1, this is automatically checked. In this case, there is no attribute Join, and the attributes below become useful.
|
Run Length Across Repetitions
|
Computes number of times the same element occurs on subsequent repetitions
|
Running Difference of '?' across repetitions
|
Computes a running sum over repetitions by adding +1 every time the element of interest occurs and -1 every time it doesn't occur.
|
Running Count of '?' across repetitions
|
Computes a running count of an element over repetitions.
|
Running Percent of '?' across repetitions
|
Computes over repetitions the running percent of occurrences of the specified element.
|
Repeat Index
|
Creates an attribute showing the repeat number for each case within the run.
|
Run Index
|
Creates an attribute that records the Run index (the number of times the sampler has been run). Hitting the Reset button will cause the next Run Index to begin again at 1.
|
Formula Attribute
|
Click to create an attribute using the Formula Editor.
|
Delete All Cases
|
Delete all the cases in the current Results table
|
Delete All Results Attributes
|
Delete all the Attribute (and their values) in the current Results table.
|
History Options
The History Options panel includes animation controls and sampler settings that you can add as attributes to the History collection. This is how the History Options panel appears in Windows:
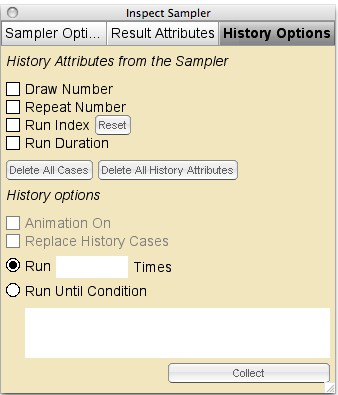
Draw Number
|
Creates an attribute that records the sampler's draw number on each run.
|
Repeat Number
|
Creates an attribute that records the sampler's repeat number on each run.
|
Run Index
|
Creates an attribute that records the sampler's Run index (the number of times the Run button has been pressed). Hitting the Reset button will cause the next Run Index to begin again at 1.
|
Run Duration
|
Creates an attribute that shows the number of seconds required for the run to be completed
|
Delete All Cases
|
Delete all the cases in the current History collection.
|
Delete All History Attribute
|
Delete all the Attribute (and their values) in the current History collection.
|
Animation On
|
Uncheck to turn off the animation that shows a ball coming from the Results table into the History collection.
|
Replace History Cases
|
Check to replace the existing cases each time the sampler is run.
|
Run ____ Times
|
Enter a value to run the sampler multiple times
|
Run Until Condition
|
Run the sampler until a specified condition is met.
|
Collect
|
Press to run the sampler.
|
TinkerPlots Help
© 2012 Clifford Konold and Craig D. Miller
|
|


