Common Uses of Formula-Defined Attributes


Common Uses of Formula-Defined Attributes |
|
|
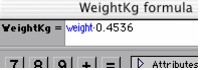
Common Uses of Formula-Defined Attributes Here we describe several common uses of formula-defined attributes. You may want to change the unit of measurement of a numeric attribute, for example, feet to meters. In the data set Backpacks.tp, the attributes BodyWeight and PackWeight are both given in pounds. You might want to convert these to some other unit, such as kilograms. A pound is equivalent to 0.4536 kilograms, so you can create a new attribute by using the conversion formula.
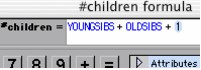
Often it's helpful to create new attributes from existing ones. For example, the data set US Students.tp includes attributes for the number of older siblings (OLDSIBS) and younger siblings (YOUNGSIBS). From these we created the new attribute #children by using this formula.
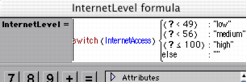
Recode Numeric Values to Categories Sometimes it's useful to make a category attribute from a numeric one. For example, in the data set US States.tp, the numeric attribute InternetAccess shows the percentage of people in each U.S. state who have Internet access. We created a new attribute that divides the states into three groupings: states with low Internet access (below 49%), states with medium Internet access (49% to 55%), and states with high Internet access (56% to 100%). To do this,
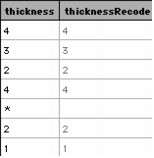
The switch function is very useful for doing this kind of recoding. In this case, the switch function starts from the top and substitutes the attribute InternetAccess for ? in each of the expressions, searching for an expression that is true. When it finds one, it stops and returns the value to the right of the colon for that expression. By specifying "else" as "" at the bottom of this list we accounted for the possibility that one or more of the cases might have a missing value. Tips for entering this formula: •You do not type the ? characters; TinkerPlots enters them for you when you start typing the characters into the parentheses. •To enter ≤, press Ctrl (Win) Option (Mac) and click the ≤ button on the formula editor keypad. •To get a new line in the switch statement, press the Insert key on your computer keyboard (Command+Option+Return also works on a Macintosh). •Remember to put the category values, like "low," in quotes. •If you get too many lines in your switch statement, you can get rid of them by pressing the Delete or Backspace keys until there is nothing left in the line. Most real-world data have missing values. TinkerPlots treats empty values (nothing in the cell) as missing. Unfortunately, there is no standard way for coding missing data, so you'll often import data that uses an asterisk * for missing data, or the word "missing." For TinkerPlots to treat these as missing, you'll need to recode the data. Suppose, as shown in the left column of this case table, that an attribute named thickness has missing values coded as asterisks, *. We want to recode the asterisks as empty values and leave everything else intact. To do this,
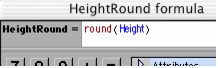
You can see the result in the second column of the case table. The formula says that if the value of thickness is a number, then keep that value. But if the value of thickness isn't a number, then replace that value with nothing (""). If you want, you can then delete the formula for thicknessRecode, and then delete the original thickness attribute. You might then rename thicknessRecode to thickness. Many data sets include attributes with decimal values. You may want, however, to use one of these data sets with students who have not yet learned about decimals. If the data set is short, you could edit values by hand. But if the data set is longer, it would be quicker to create new attributes using the round function. For example, in the data set Dinosaurs.tp, the attribute Height includes decimal values. You could make a new attribute, HeightRound, that rounds values of Height to the nearest whole number by using this formula.
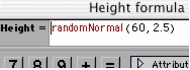
After creating the new attribute, you would probably want to remove the original attribute. To do this, first open the formula for HeightRound and delete it. This will leave the computed values in place. Now you can delete the attribute Height. You might also want to change the name of the new attribute from HeightRound to just Height and perhaps move it from the bottom of the data card to where the original attribute was. Note that you can specify the number of decimal places to round to. Entering round (height, 1) would round the values to one decimal place. TinkerPlots has a lot of functions you can use to make up data for instructional purposes. Suppose, for example, you want sample data that are approximately normally distributed with a particular mean and standard deviation. You can quickly generate a large sample using the function randomNormal. Here, for example, is how you'd make a group of 100 students who were 60 inches tall on average with a standard deviation of 2.5 inches.
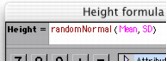
TinkerPlots will assign random values to the 100 cases by randomly drawing from a normal distribution with mean of 60 and standard deviation of 2.5. Rather than entering fixed values for a function like this, you could enter the names of sliders in their place. With the randomNormal function, for example, this would allow you to dynamically change both the value of the mean and the standard deviation and watch the data in the graph change as you do it. To enter slider values into the above attribute formula, you'd create two sliders, one named Mean and the other SD (see Make a Slider). In the formula editor, you'd enter these slider names instead of values. In this case, here is what the formula would look like.
The Data and Demos | Demos folder contains several files that use this approach to create realistic data that you can manipulate with sliders to make up data of various kinds. See, for example, Sample Means Demo.tp or Medical Test Demo.tp.
|